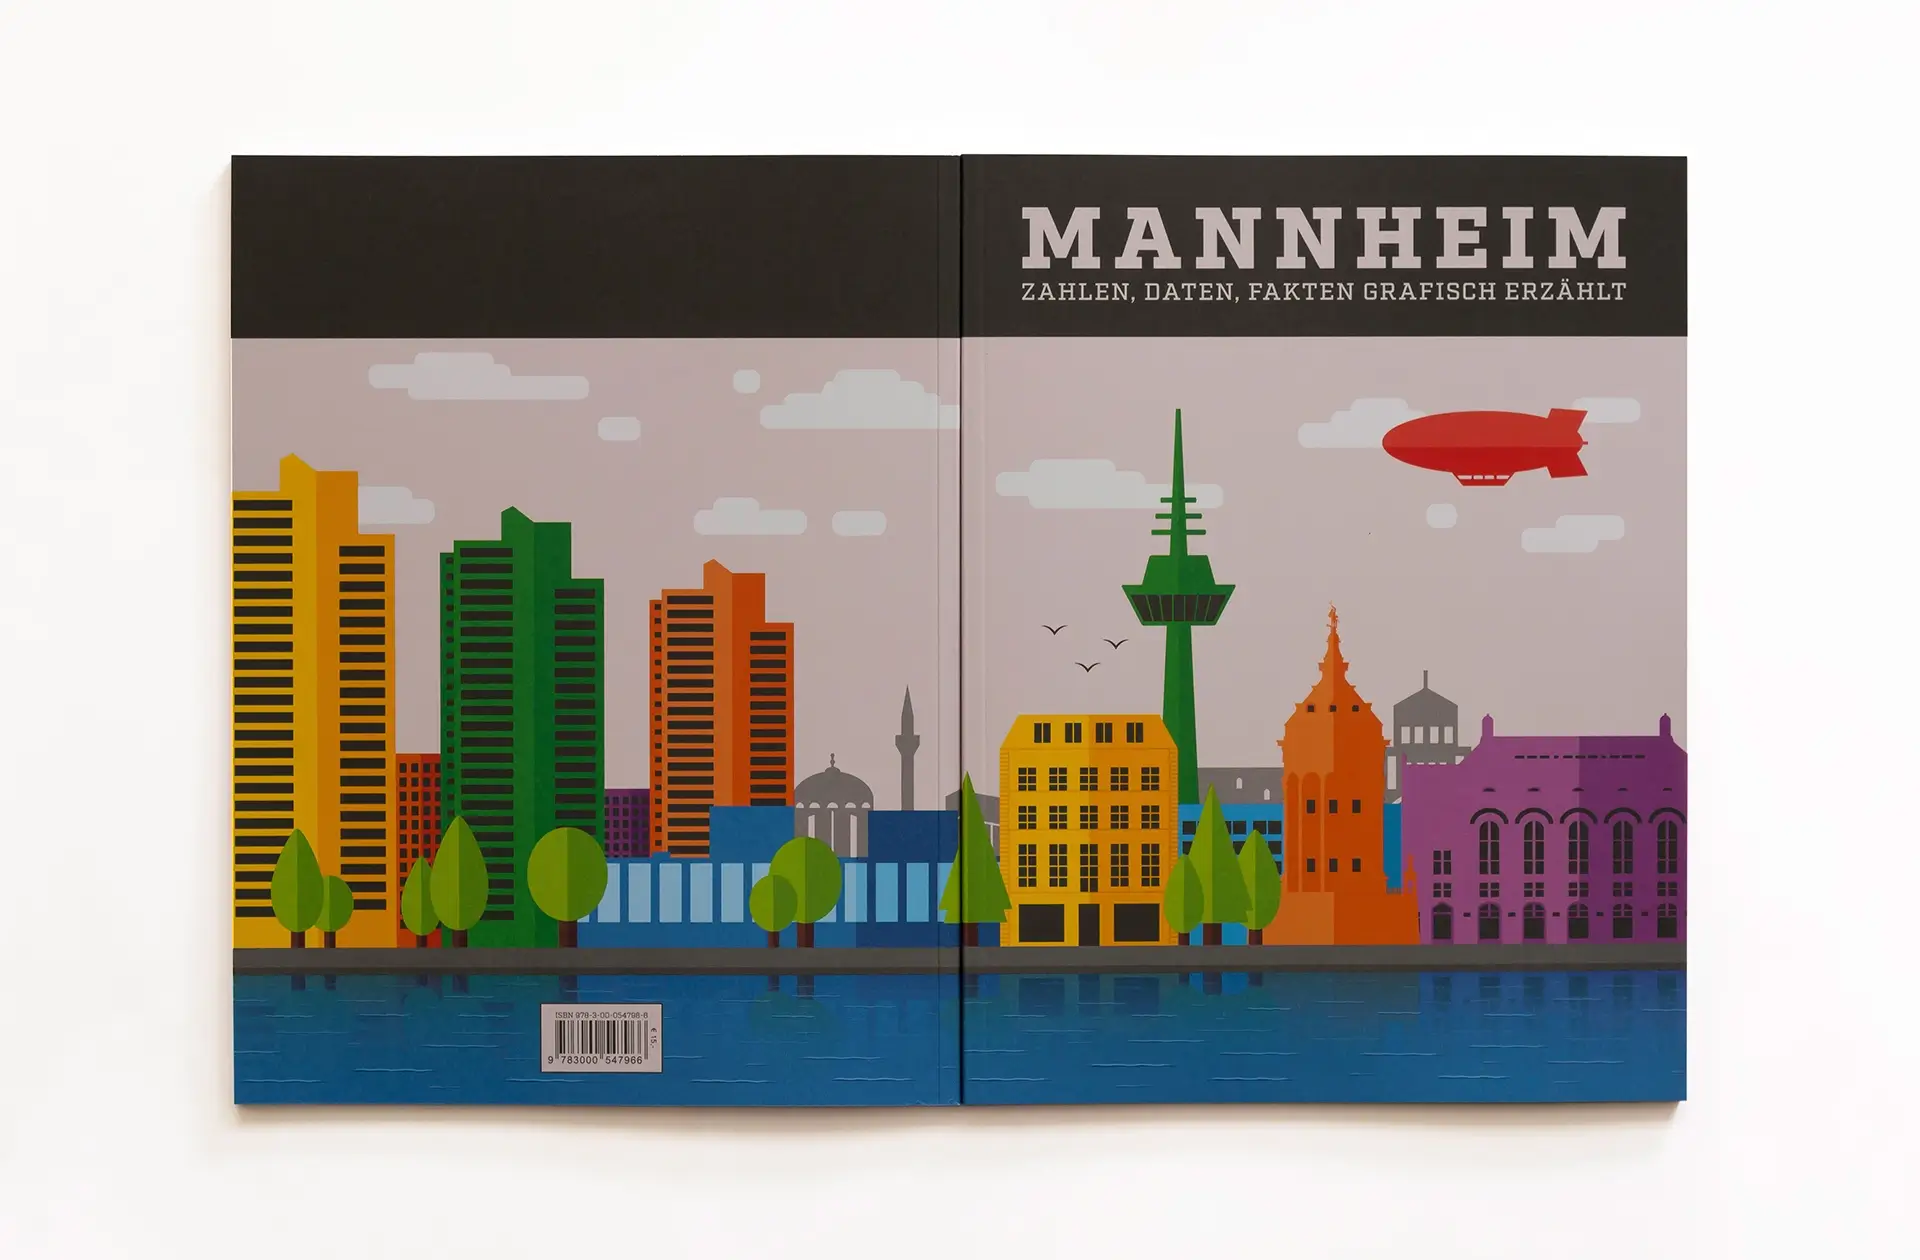
Mannheim numbers, data, facts told graphically
This book is the final thesis and the result of my studies at the graphic design school Manuel Fritz. Since the topic and the type of project were freely selectable, I decided to combine the good with the useful. That was on the one hand my preference for infographics as well as print media and on the other hand the fact that I wanted to get to know Mannheim better, the city in which I had lived for just over 2 years. Mannheim is not a city you fall in love with at first sight, but it has a lot of charm and history. This has become all the clearer to me as I have converted the information collected into corresponding graphics.
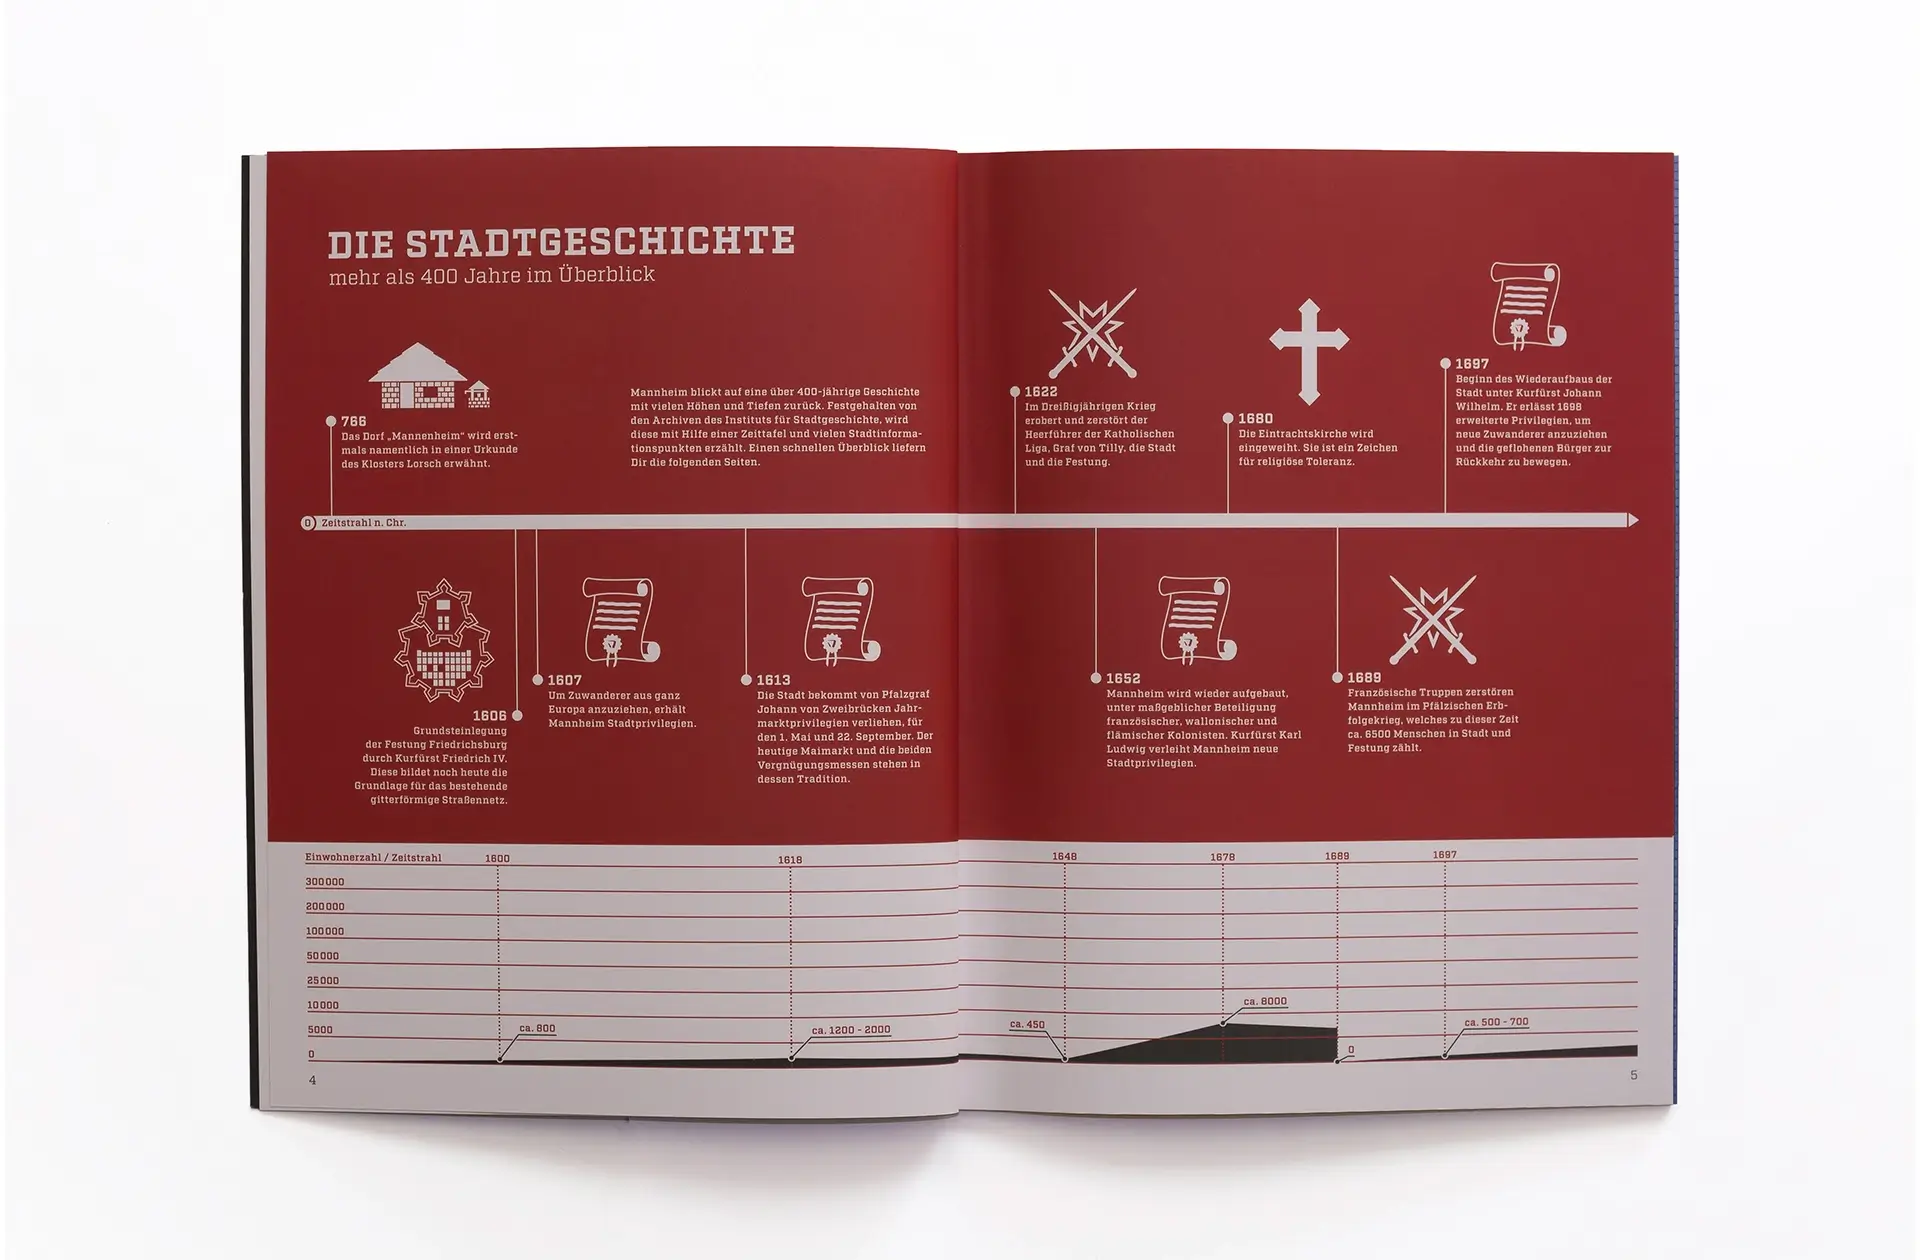
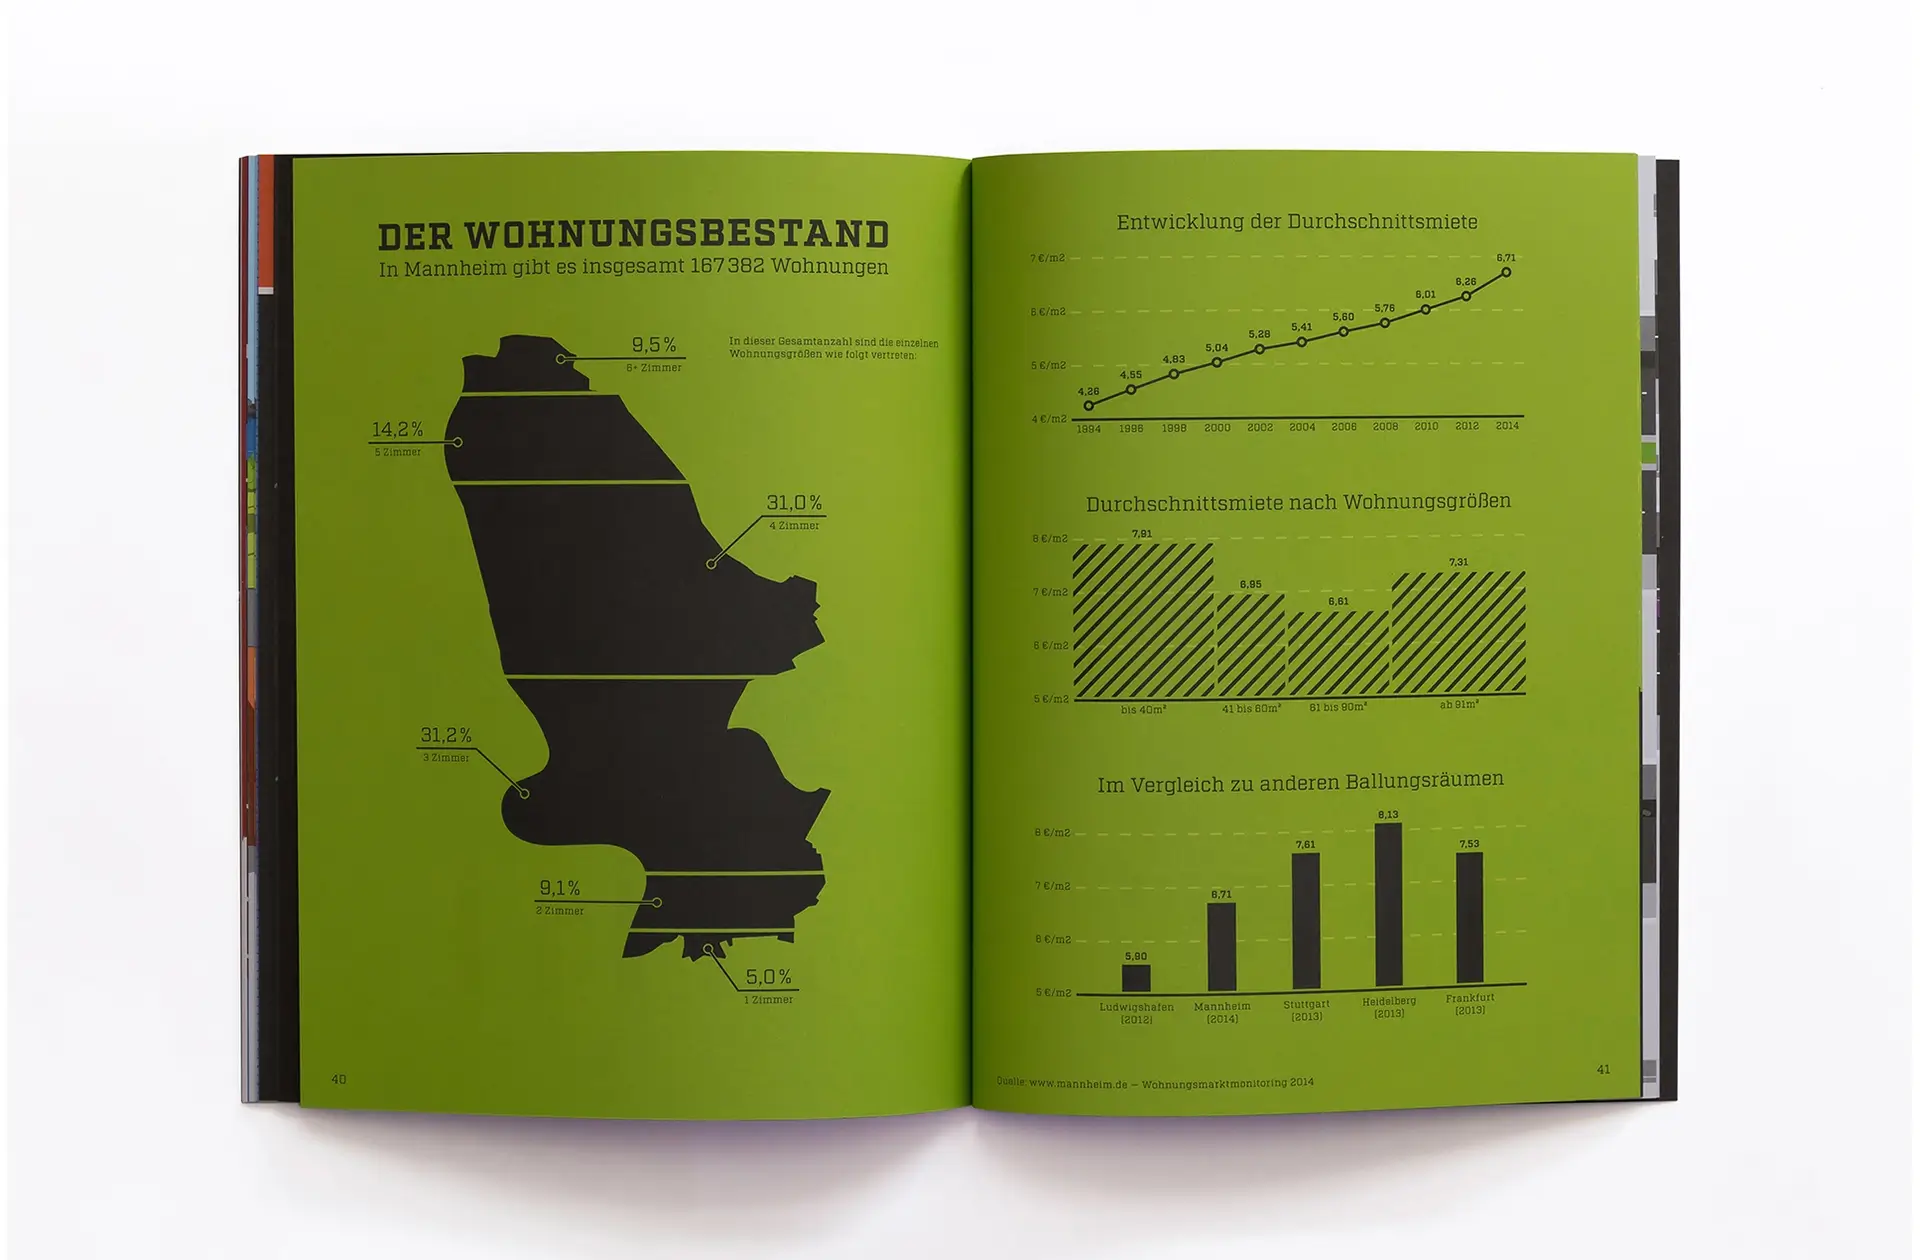
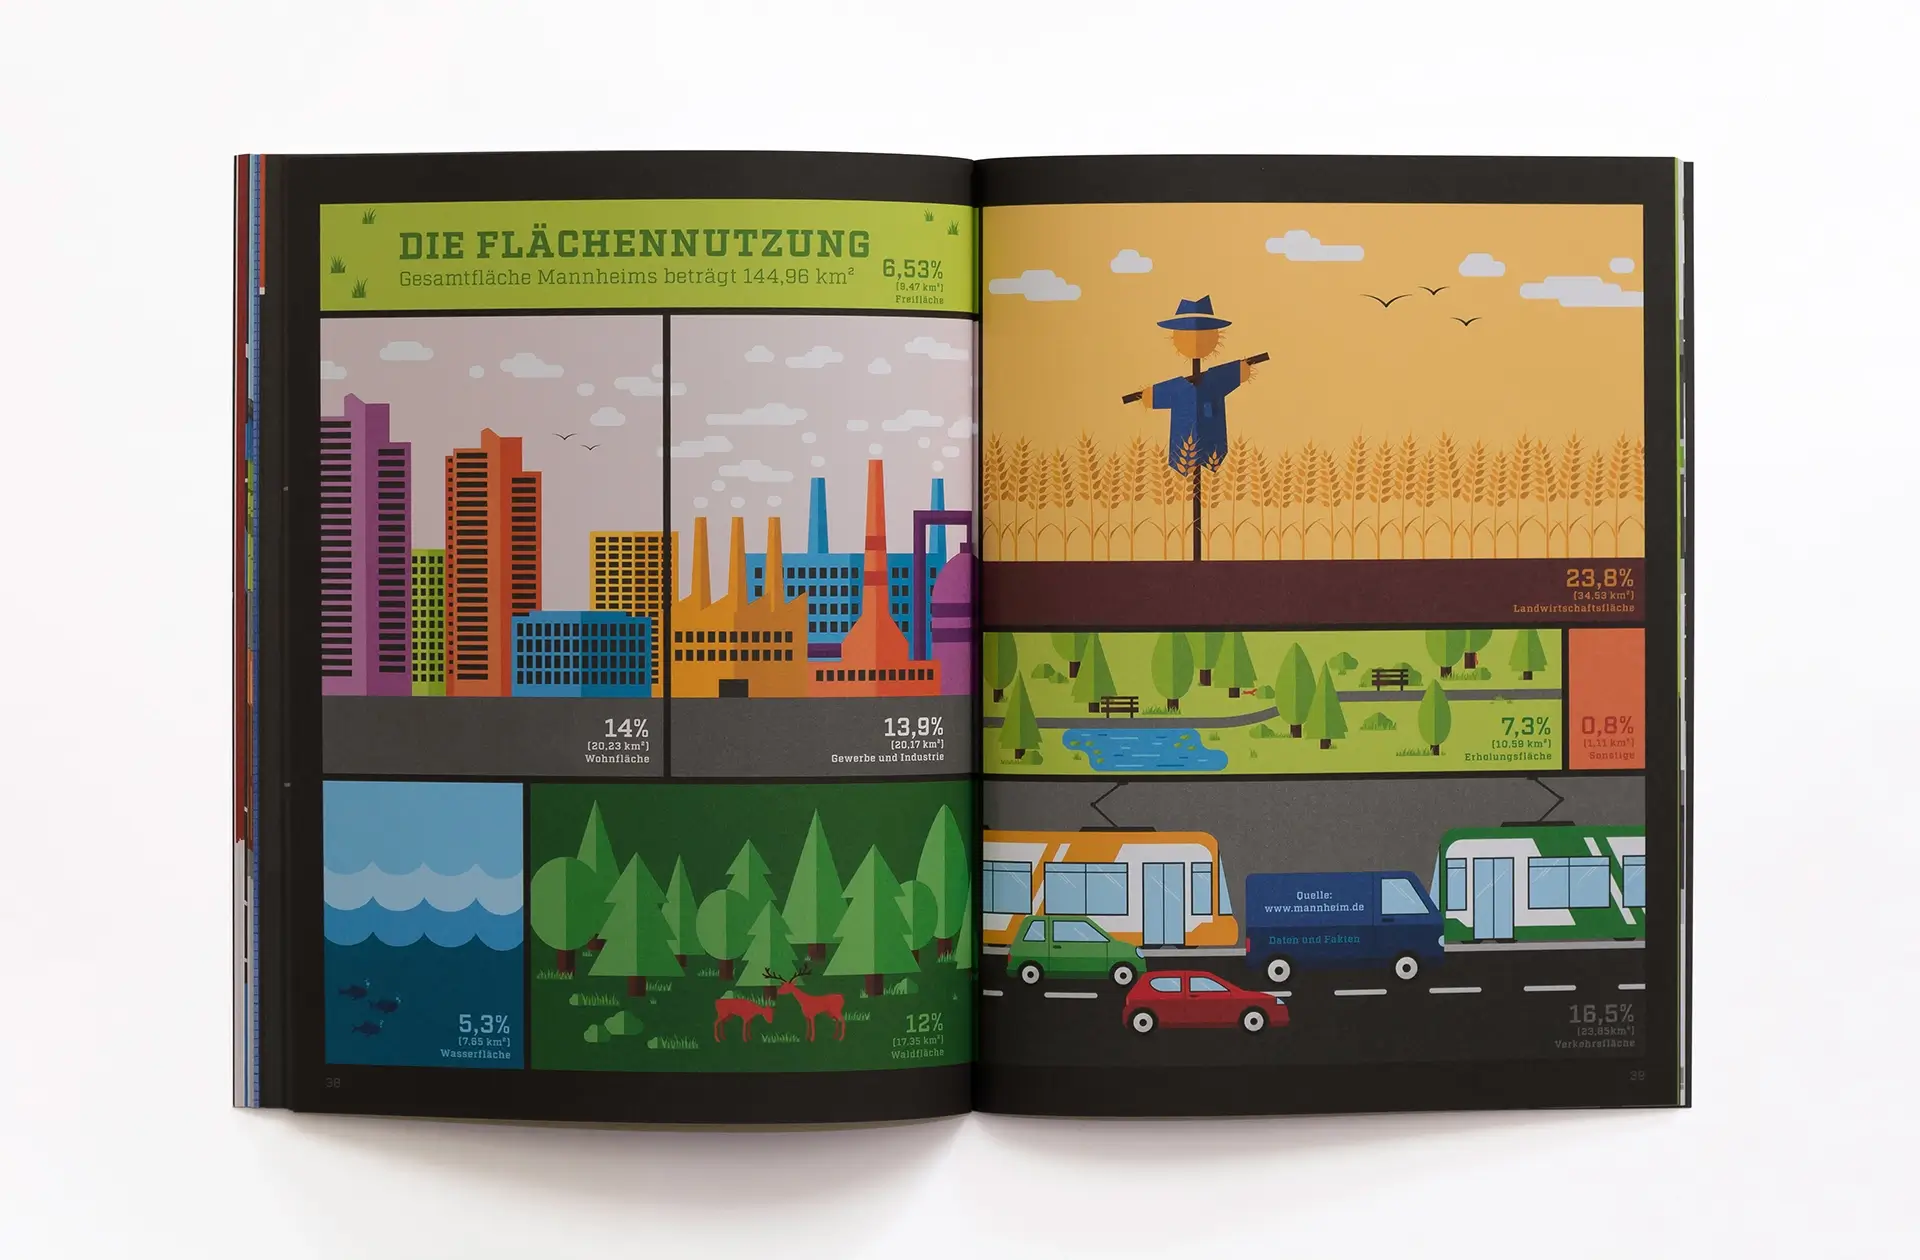
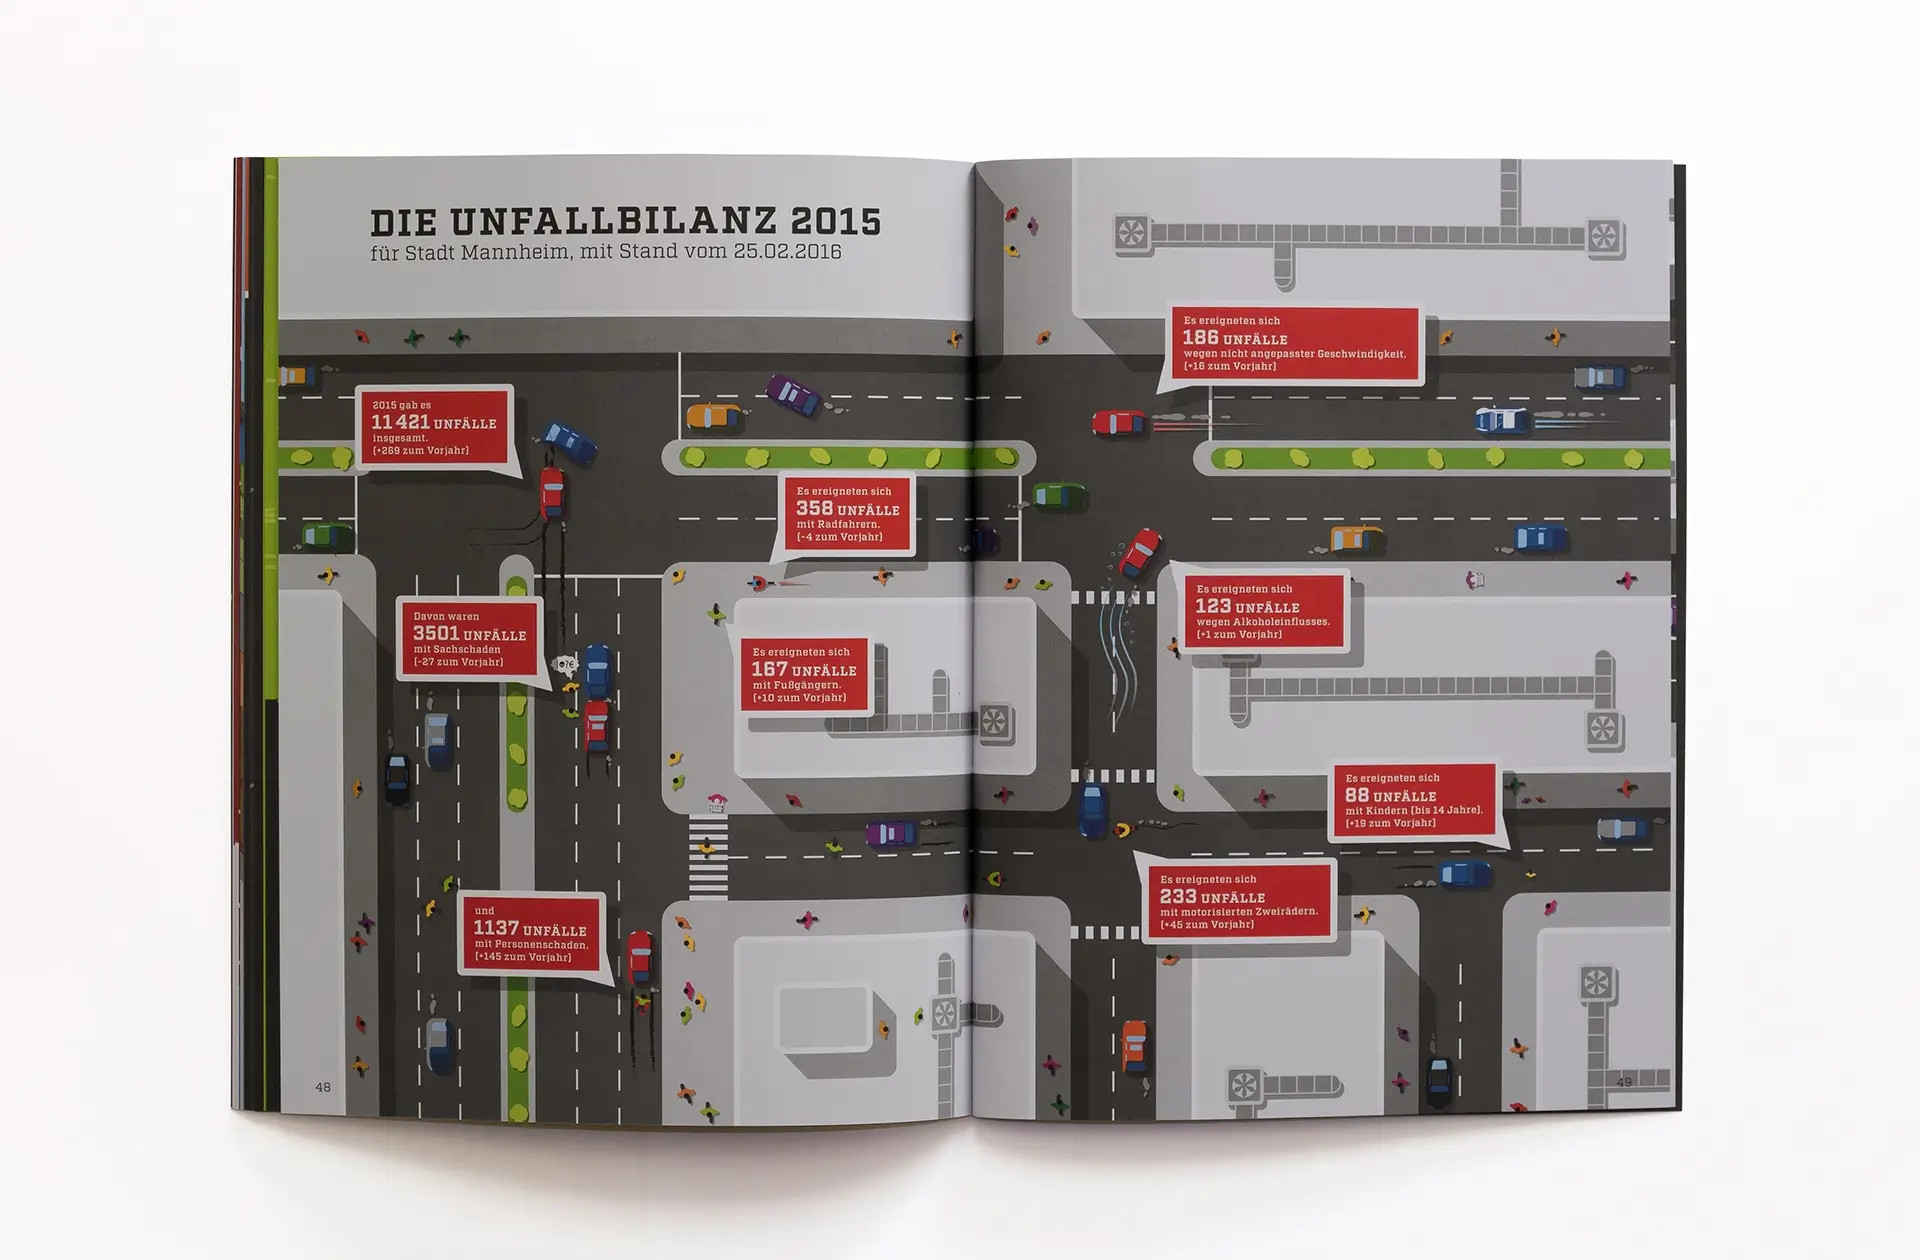
On 50 sides the interested reader can read crisp compact numbers, data and facts of the city of Mannheim. These include the rich city history, interesting places, population figures for the whole of Mannheim and its districts, an overview of the most frequent accidents, an overview of the housing stock by districts, the distribution of space in the city and of course information about the two most important sights, the water tower and the Baroque castle.
In addition to a high design standard, it was important to me to reflect this in the production. For this reason, the book was printed on high-quality uncoated paper with the help of the printing company “Abt” in Weinheim and then bound. The result is a book for the eyes and the mind, as well as a great feeling in the hand.
The book “Mannheim numbers, data, facts told graphically” was available from October 2016 to the end of 2017 in various bookshops in Mannheim and online for 15,- €. Currently there is no possibility to buy it in stores.
